Note: This tutorial uses code written in GraphQL, JavaScript, and Objective-C, but I will try and address the major implementation details at an abstract level, as they are not language-specific.
I recently participated in Zora’s API Hackathon, and have been building with it pretty much nonstop ever since–it’s easy to pick up, even for GraphQL novices, but also lets you go really deep when needed. This makes for an API that’s accessible yet powerful, which isn’t something you see every day. It’s been perfectly suited to the task of NFT analytics, and I’ve been having a lot of fun exploring the capabilities of the API over the past couple weeks.
More recently, I’ve been experimenting with plotting NFT sales data on scatter charts, which has led to all sorts of new possibilities for visualizing different types of signals that might not otherwise be apparent. I’m really excited with where my research is heading, and can’t wait to share more about it in the future. In the meantime, all of this work with the Zora API has led to random thoughts like “I wonder if I could visualize recent Zorbs sales, showing each Zorb with the correct color?”
Last night I challenged myself to find out. This tutorial is the end result.
Getting Sales Data
Let’s start by figuring out what data we’ll need if we want to display recent Zorbs sales on a scatter chart. At a bare minimum, we’ll need two pieces of data in order to plot a point: the timestamp for the sale, and the sale price.
Here’s the GraphQL query that will fetch that data from the Zora API:

Now, in practice we’re going to want to request more information from Zora’s API than just that. Keep in mind that the goal is not only to display recent Zorb sales, but to do so in a way that indicates the color of each Zorb. Don’t worry about how we’ll display the data just yet. For now, we’re just in the planning stage. What other data might we want?
I can immediately think of two pieces of data:
- Token ID
- Token Metadata
The token ID will come in handy during testing and troubleshooting — if we’re in any doubt as to the accuracy of the data, we can always use the token ID to cross-reference the transaction data on etherscan.io.
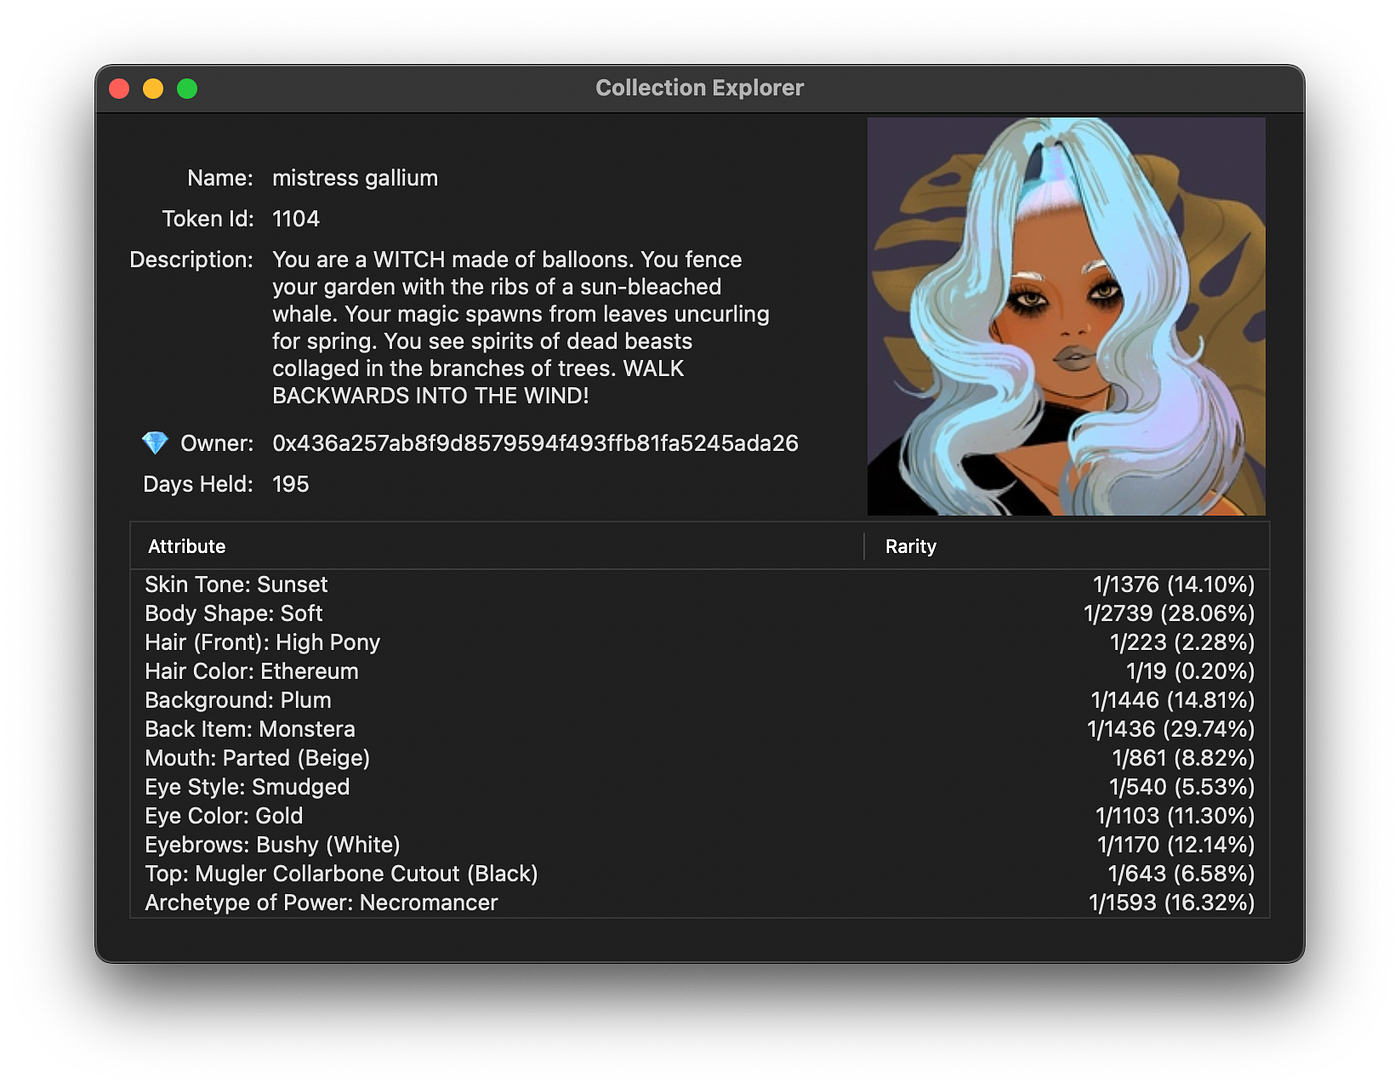
The token metadata is where we’ll find information on the Zorb’s display image, which changes based upon wallet address.
Further, we can set some constraints on our GraphQL query — by limiting it to the most recent 500 sales, we can create a one-shot query, and won’t need to worry about handling multiple pages of results. This is not only kinder on Zora’s API servers, it keeps things simpler on the code end of things as well. Remember, we can always expand our program’s capabilities in the future!
So, what does our final ZORA API query look like?

We can verify the output for our query on Zora’s API Playground and get an idea of the format of the data we’ll be working with:

It looks like all the information we requested is there, but what about that big blob of data for the Zorb’s image? How are we supposed to get from that to a specific Zorb color to display? Before we get to the specifics, it’s time for a…
SVG SEGUE
Some NFTs store their data completely on-chain, making use of the Scalable Vector Graphics (SVG) file format to achieve a small data footprint while still packing in a lot of potential when it comes to the image being stored. I covered this topic in detail back in October 2021 if you’re interested in further reading on the subject. If you’re familiar with the topic already and just want to get on with the tutorial, keep reading for the speed run version.
Deciphering the Data
Ok, so how do we get from that blob of image data to individual Zorb colors?
We know from the data URI scheme that the image data is base64-encoded, so let’s decode it to see what it looks like. You can do this in code, but there are some websites where you can test it out as well. Just don’t forget to strip out the data:image/svg+xml;base64, prefix if you’re going with the website route, or it won’t decode correctly.
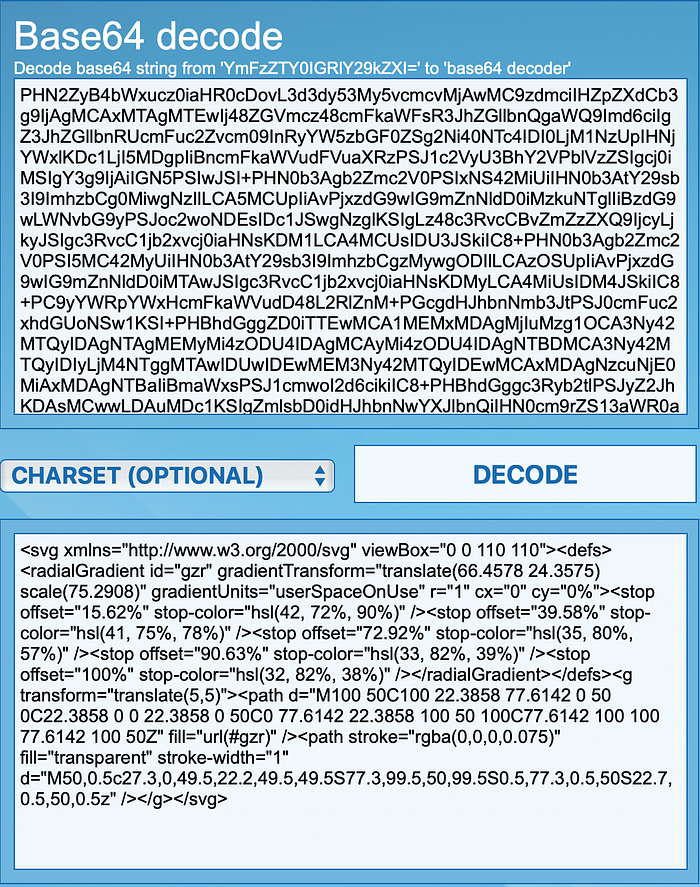
Here’s what the base64-decoded image data looks like:
If you copy and paste the output into a plain-text .html file and then open it with your web browser, you should see the Zorb in all its glory:
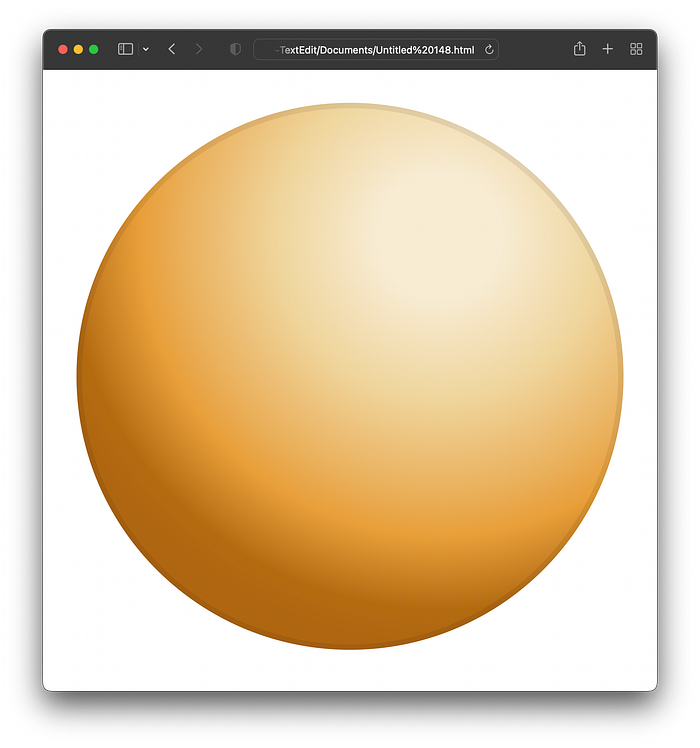
So, we’re getting closer, at least we can see how the image is constructed for any given Zorb. There is actually a ton of interesting code to dig into if you’re interested in the technical implementation of the Zorb color-changing side of things. Take a look at the gradientForAddress function in the Zorbs smart contract if so.
For the purposes of this tutorial, however, we’re keeping things simple, and we can analyze the SVG output without actually needing to understand the implementation details. The only thing we care about is identifying the main display color for each Zorb. Looking at the SVG output, we can see five references to something called stop-color, each with an hsl value. HSL stands for Hue, Saturation, Luminosity, and is a way of representing specific colors. Bingo.
We can verify that the HSL values we see in the decoded svg image data match the colors of our Zorb on a site like HSLPicker.
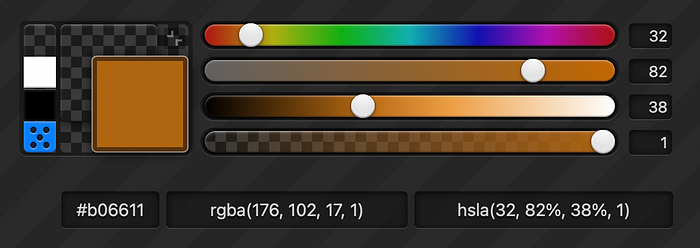
There are a couple things to note here: some Zorbs are more than one color, others aren’t. It’s all based on the wallet address holding the Zorb. It’s up to you how you want to visually convey the Zorb’s color–for example, you might want to calculate the median of all five HSL values, and use that for the display color. For the purposes of this tutorial, however, we’re simply going to stick with the value that corresponds to the lower left of each Zorb image (i.e. the last stop-color value).
Before we continue, let’s take a look at where we’re at:
- We know how to ask the Zora API for recent Zorbs sales data.
- We know how to decode the SVG image data for any Zorb.
- We know how determine the HSL values that correspond to a Zorb’s color.
So we’ve got all the data we need to plot any given Zorb sale in the correct color, where do we go from here? How do we actually display this data in a meaningful way?
Displaying the Data
If you’re not opposed to working with third-party libraries, canvasJS offers a number of highly customizable options, and will work perfectly for the purposes of this tutorial. I ended up going for the Multi Series Scatter/Point Chart, as it allows marker customization on a per-entry basis, perfect for the multitude of Zorb colors we’ll need to handle. Even better, it can handle HSL values right out of the box, so you don’t have to worry about converting the color to RGB or hex.
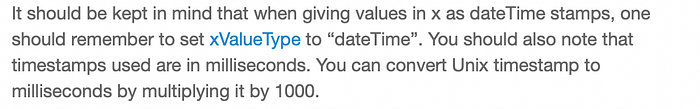
Looking at the documentation, it appears we’ve got a couple options when it comes to handling the timestamps for Zorb sales. We can either construct a new JavaScript Date object, or we can specify a timestamp in milliseconds. Date conversions are notoriously tricky things, especially when you start accounting for time zones and locales, but we don’t need to go that far in this tutorial. Converting a timestamp from the format we get from Zora’s API to one we can use with canvasJS is as simple as getting the Unix timestamp and multiplying it by 1000 to get a timestamp in milliseconds. Passing that along to canvasJS is all we need to do, canvasJS handles the rest.
You’ll definitely want to dig around in the canvasJS documentation, there are tons of customization options that I’m only scratching the surface of here.
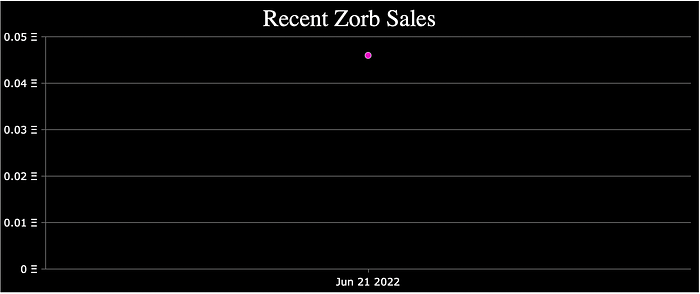
Here’s one way of setting it up:

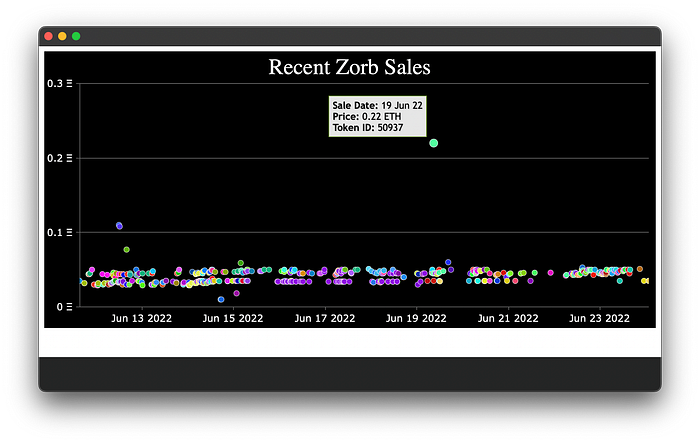
I added a few basic design touches, such as setting the chart background color to black, and giving each Zorb sales entry a white outline to make it stand out a bit. When you mouse over a data point, a tooltip will show the sale date, price, and token ID. Some test data allows us to get an idea of what it’ll look like once we start charting data points:
So, now that we know what data we need to get from Zora’s API, how it’s formatted, and the format we need it to be in for canvasJS, we’re tasked with the matter of actually getting the data from the Zora API, parsing it, and sending it to canvasJS.
Bringing it all together
I’ve implemented this part in Objective-C, but you can use whatever programming language you’re most comfortable with — plenty of libraries and frameworks exist allowing you to call GraphQL directly from JavaScript.
In this case we’ll be using an extended version of Ponder–my entry for the Zora API Hackathon–to power the interactions with Zora’s API server.
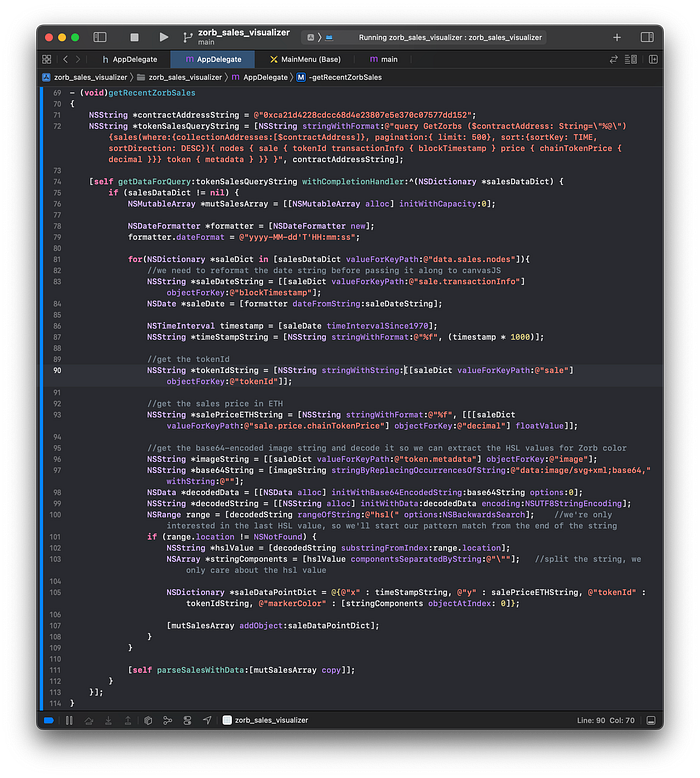
First, we’ll request the data we want from Zora’s API server using a GraphQL query. Once we get a response back from the server, we’ll parse the data a bit in order to get it into the correct format to use with canvasJS. This mostly involves base64 decoding and slicing up the resulting strings to grab the HSL value for each Zorb sale, and keeping track of it along with some other basic sales data, then passing it along to another function for further parsing.
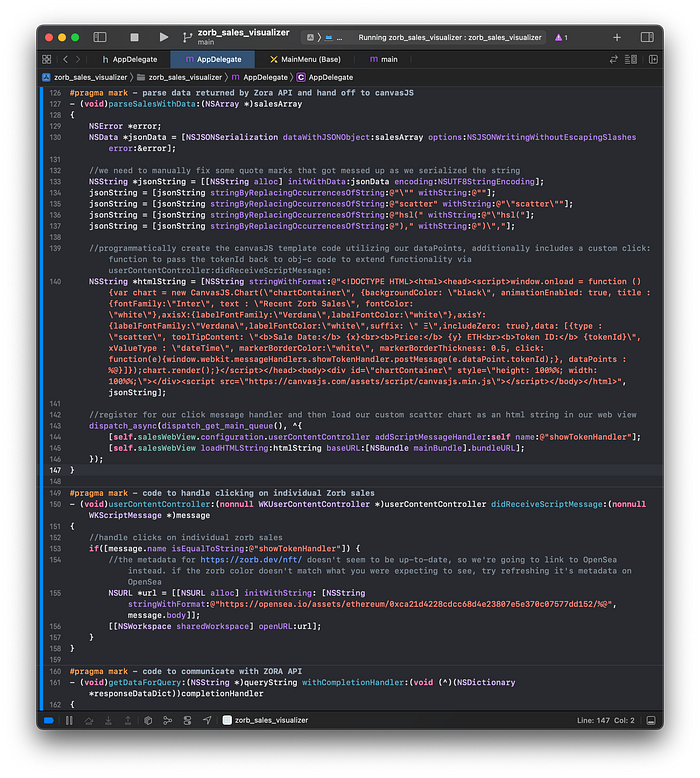
Next, we create our canvasJS template directly in code, setting the dataPoints to our previously created array of reformatted sales data. We’re also including a custom handler for click events on individual Zorb sale markers. This allows us to send the tokenId back to objective-c, where we can use it to open a webpage directly to that particular Zorb. This makes verification of sales data and Zorb color a snap.
When we put it all together, here’s the final result:
Note: You may find Zorb display colors don’t match up with what you see on OpenSea or other sites. Try refreshing the metadata and you should see the correct colors. You might notice price discrepancies across various marketplaces, always verify data on-chain when possible.


So, there you have it. Using the new Zora API, it’s definitely possible to keep track of recent Zorb sales by color. This tutorial only scratches the surface of what’s possible when you combine Zora API with canvasJS. You can find the tutorial code over on github if you want to play around with it yourself. I’d love to see your creations, please let me know what you come up with!
Grab the source code over at GitHub:
References
zorb_sales_visualizer source code: https://github.com/nptacek/zorb_sales_visualizer
Zora API Reference: https://docs.zora.co/docs/zora-api/intro
Zora API Playground: https://playground.api.zora.co
canvasJS Documentation: https://canvasjs.com/docs/charts/basics-of-creating-html5-chart/
canvasJS scatter point chart demo: https://canvasjs.com/javascript-charts/multi-series-scatter-point-chart/